At the conference in Santander, I was particularly taken with a presentation by Jorge Yzaguirre from the Bolsas y Mercados Españoles (BME).
BME is the Spanish company that deals with all of the organisational aspects of the Spanish stock exchanges and financial markets, as well as providing clearing and settlement and technology consulting in 23 countries focused upon trading systems.
Jorge presented in Spanish with English slides so I didn’t get much of the words, but the slides speak volumes.
The discussion was all about that American flash crash on May 6th.
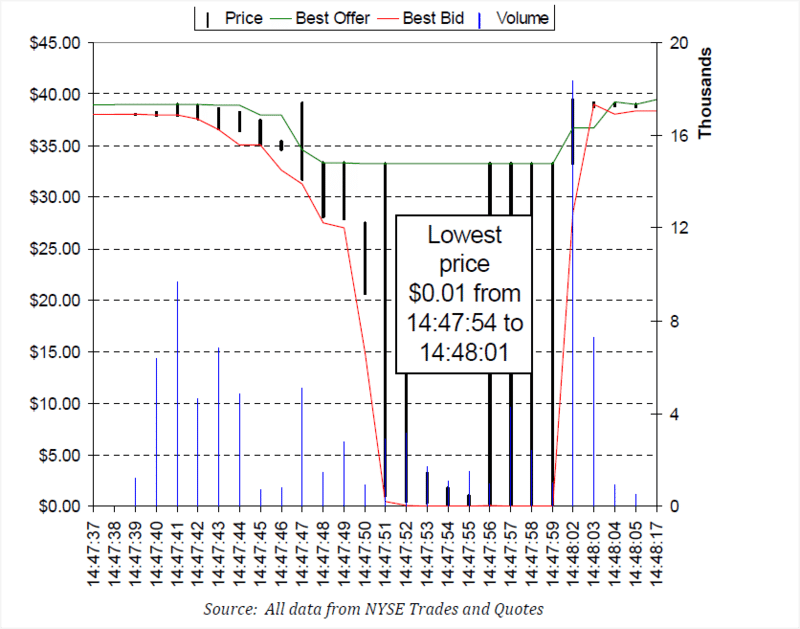
This was the one when Accenture’s share price went from $41 at 2:30 p.m. to just one cent at 2:48 p.m.
Tsk, tsk.
I’ve read lots of explanations of the crash, and it boils down to bad programming or a virus it seems that caused a glitch in the system.
For the best explanation looking at all this stuff, checkout Nanex’s website.
The flash crash illustrates the fragility of our markets and how exposed they are to massive data spikes and bursts.
What would happen if crossing systems were seriously cross?
Well now we know and sure, we’re working on addressing such issues, but what I liked about Jorge’s presentation is that it’s the first time I’ve seen someone present what happened (rather than just reading it).
I also like the charts he used, so here’s a wee selection.
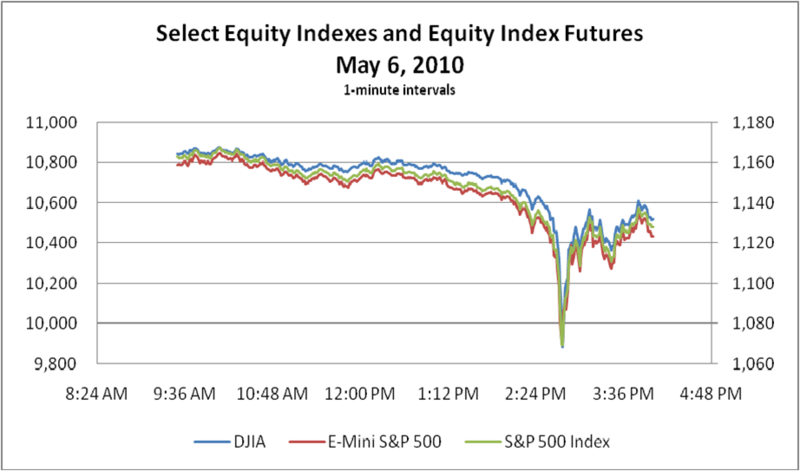
The market indices went into a meltdown in the afternoon of May 6th.
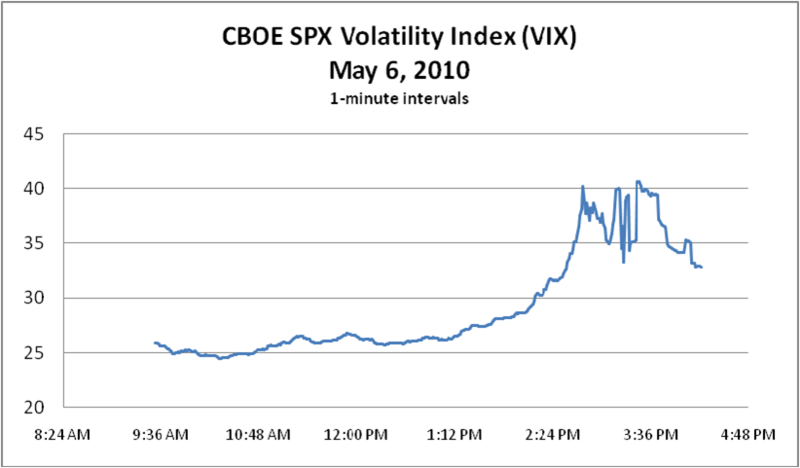
 With the Volatility Index at the Chicago Board of Exchange zapping skywards.
 The brown stuff hits the fan at 2:48, when Accenture’s share price hits rock bottom.
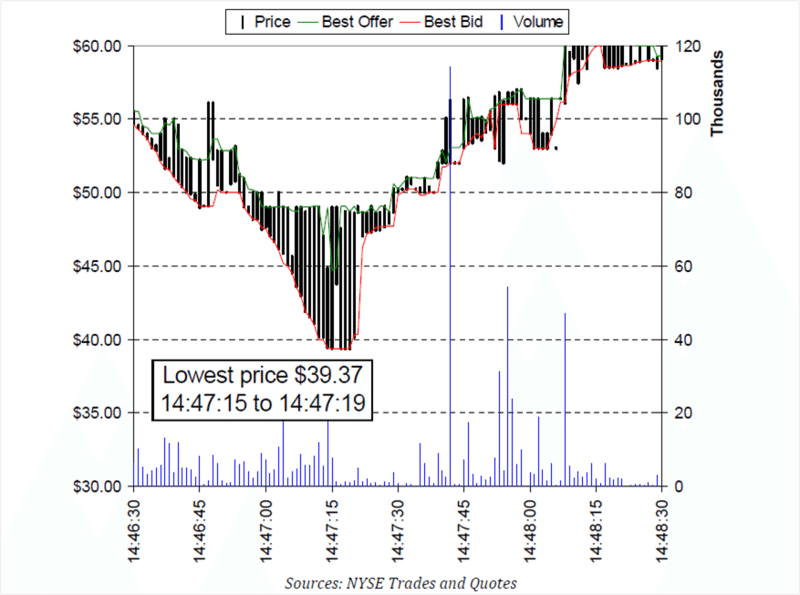
 As did Procter & Gamble.
And Exchange Traded Funds (ETFs) such as iShares.
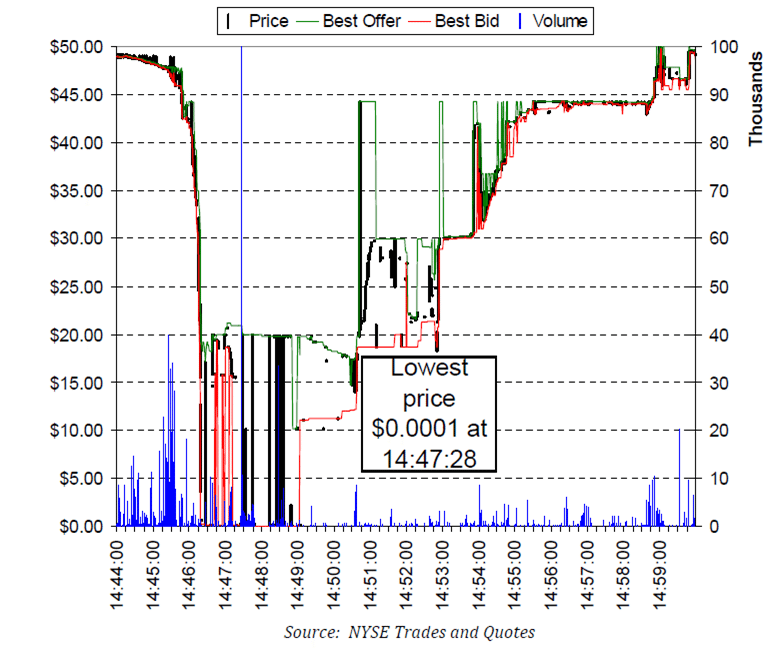 Around the same time, shares such as 3M hit bottom.
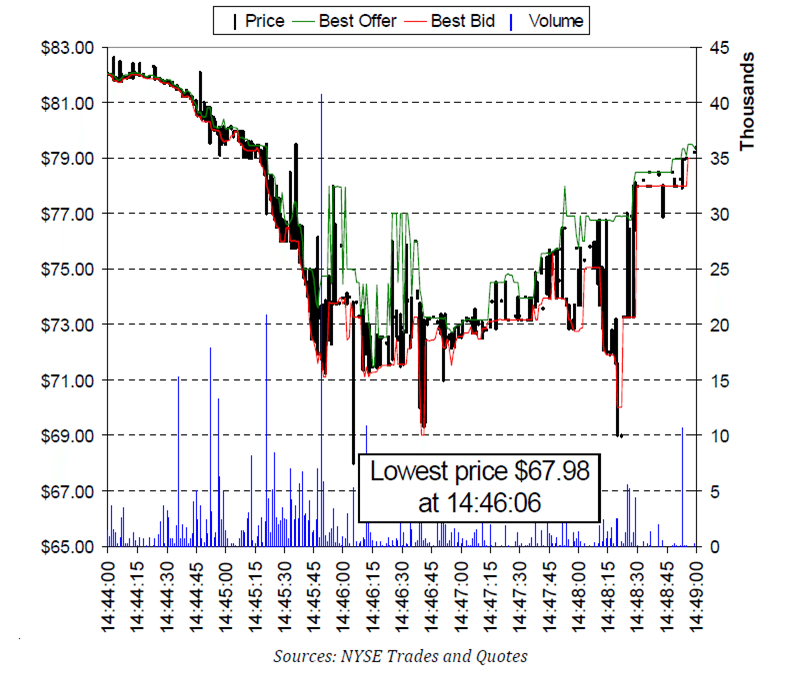 As did IBM.
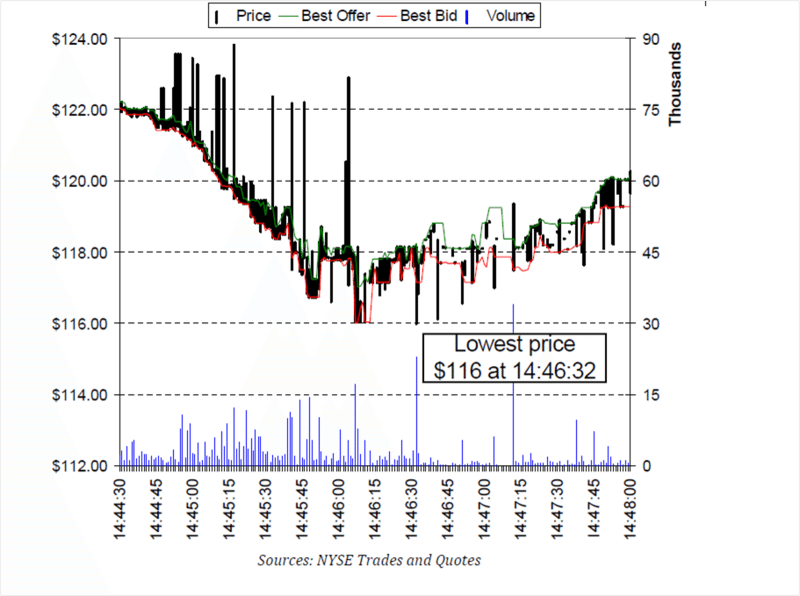 And Intel.
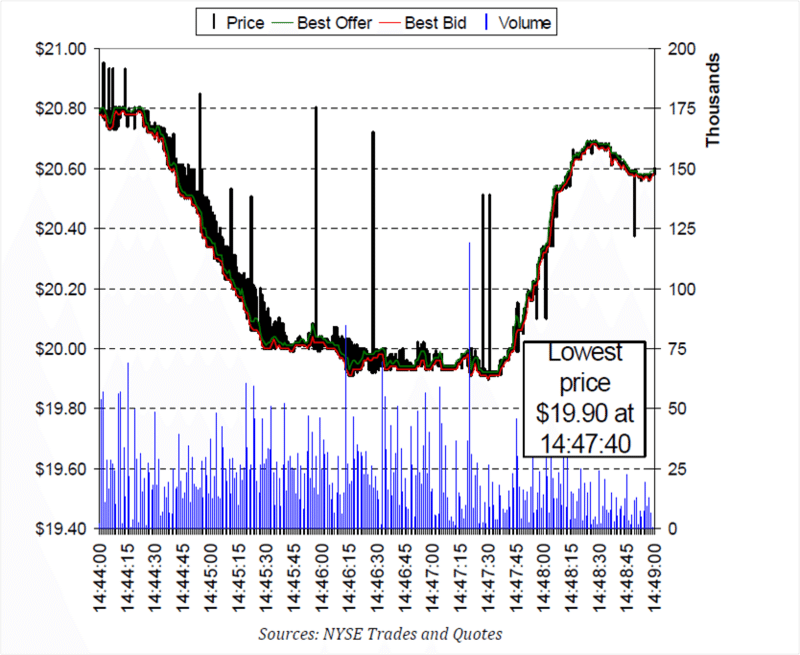 Meanwhile, some equities rocketed, such as the price of Sotheby’s, that auction house.
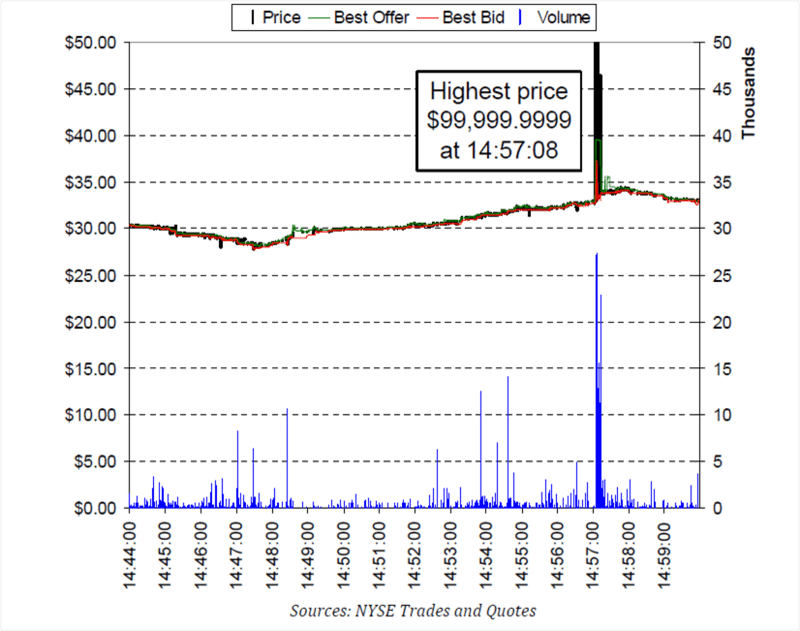 Going, going, that’s a gonner!
Overall, the volatility was massive as electronic liquidity provider’s black box algorithms traded intermarket sweep orders aggressively between the market makers and taker robots.
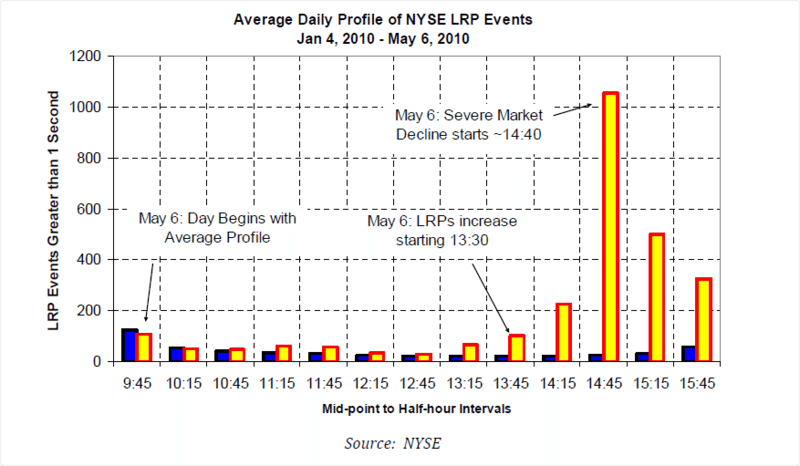
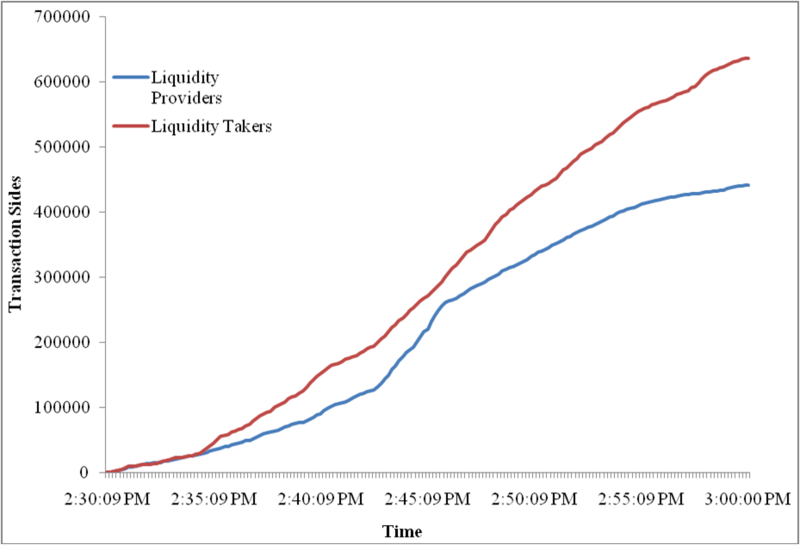 Which is why daily liquidity replenishment points –
a NYSE volatility control
built that automatically converts the markets' to “slow”
or Auction Market only mode temporarily, allowing specialists, floor brokers and
customers to supplement liquidity and respond to the stock’s volatility (see comments) – went through the roof.
 So there you have it.
Jorge did put a load of other slides up there, but I think this collection gives you a good flavour of what happened.
Now you may think this is a one-off, but our globally interlinked trading systems often spike and move in rapid cycles.
Just take a look at this chart which illustrates the ups and downs of the markets over the last five years, and take particular note of September 2008 when Lehman Brothers collapsed.
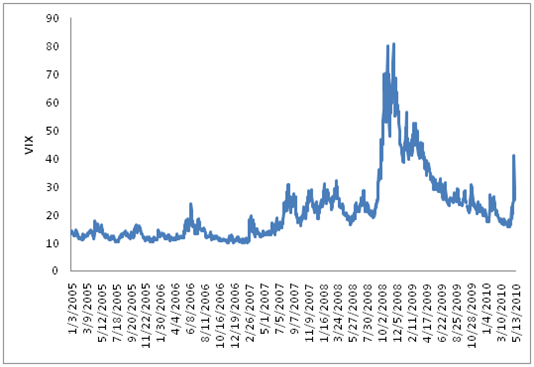 No wonder the non-rocket scientists, general investor, market participants and now legislators all fear High Frequency Trading (HFT) systems ... and why the ruling now is that any move in a stock price by more than 10% of its value in either direction in a five minute trading period, will result in a stop trading break of five minutes to ensure it's not some gaming going on.
Oh and yes, the whole thing was Apple's fault anyway.
Chris M Skinner
Chris Skinner is best known as an independent commentator on the financial markets through his blog, TheFinanser.com, as author of the bestselling book Digital Bank, and Chair of the European networking forum the Financial Services Club. He has been voted one of the most influential people in banking by The Financial Brand (as well as one of the best blogs), a FinTech Titan (Next Bank), one of the Fintech Leaders you need to follow (City AM, Deluxe and Jax Finance), as well as one of the Top 40 most influential people in financial technology by the Wall Street Journal's Financial News. To learn more click here...

